The State of New Hampshire tracks the dates when lakes and ponds freeze over (Ice-In) and thaw (Ice-Out). The New Hampshire Department of Environmental Services (NHDES) maintains records for some lakes dating back more than a century. In 2011, NHDES expanded the program to allow local residents to submit Ice-In and Ice-Out dates online. Clough Pond’s records go back to 1969 and were added to the state’s database in January 2016.
“Tracking both ice-in and ice-out allows the determination of total ice cover days which is another important part of tracking physical, chemical and biological changes to lakes over time. With the erratic weather conditions experienced in recent years, the information can also help track climatological shifts and trends.” (NHDES)
Anybody with their own collection of Ice-In/Ice-Out dates for Clough Pond is encourage to make their data available, either by submitting it online directly to NHDES or simply make it available to an officer or member of the Board of Directors of the CPA and we will see to it that the data is entered into the state database.
Kathy Shields provided the earlier Ice-Out dates as recorded by her mother Katherine F. Bogle. If anybody has the missing data or even different dates than listed please help us complete the table below.
The state recognizes that each lake or pond, or even the individual keeping the record, may have used varying rules for how they determined the date when the water body transitioned from frozen to not frozen and vice versa. They accept whatever definition has been used in the past. That provides the greatest consistency of data per water body over time.
For Clough Pond, unlike say Winnipesaukee, there is not much leeway for determining whether the pond is still frozen over or not. So, whatever data anybody may have on Clough Pond would likely be relatively consistent across years and very desirable to be in the database. Kathy Shields is now our monitor and recorder of Ice-In and Ice-Out.
Kathy uses the rule: “If Mike can row his skull from their place to the boat ramp and back around the buoy markers then it is Ice-Out.” Yes, there might still be some ice along the southern shore in the shade but as a measure of Ice-In and Ice-Out, navigability rules here.
| Ice-In | Recorded By | Ice-Out | Recorded By | Ice-In Days |
| <No Data> | 21 Apr 69 | K. Bogle | N/A | |
| <No Data> | 23 Apr 70 | K. Bogle | N/A | |
| <No Data> | 27 Apr 71 | K. Bogle | N/A | |
| <No Data> | 24 Apr 72 | K. Bogle | N/A | |
| <No Data> | 7 Apr 73 | K. Bogle | N/A | |
| <No Data> | 5 Apr 74 | K. Bogle | N/A | |
| <No Data> | 19 Apr 75 | K. Bogle | N/A | |
| <No Data> | 6 Apr 76 | K. Bogle | N/A | |
| <No Data> | 9 Apr 77 | K. Bogle | N/A | |
| <No Data> | 20 Apr 78 | K. Bogle | N/A | |
| <No Data> | <No Data> | N/A | ||
| <No Data> | 4 Apr 80 | K. Bogle | N/A | |
| <No Data> | 30 Mar 81 | K. Bogle | N/A | |
| <No Data> | 21 Apr 82 | K. Bogle | N/A | |
| <No Data> | 22 Mar 83 | K. Bogle | N/A | |
| <No Data> | 14 Apr 84 | K. Bogle | N/A | |
| <No Data> | 30 Mar 85 | K. Bogle | N/A | |
| <No Data> | 2 Apr 86 | K. Bogle | N/A | |
| <No Data> | 6 Apr 87 | K. Bogle | N/A | |
| <No Data> | 9 Apr 88 | K. Bogle | N/A | |
| <No Data> | 11 Apr 89 | K. Bogle | N/A | |
| <No Data> | 7 Apr 90 | K. Bogle | N/A | |
| <No Data> | 23 Mar 91 | K. Bogle | N/A | |
| <No Data> | <No Data> | N/A | ||
| <No Data> | 16 Apr 93 | K. Bogle | N/A | |
| <No Data> | 14 Apr 94 | K. Bogle | N/A | |
| <No Data> | 25 Mar 95 | K. Bogle | N/A | |
| <No Data> | <No Data> | N/A | ||
| <No Data> | 15 Apr 97 | K. Bogle | N/A | |
| <No Data> | <No Data> | N/A | ||
| <No Data> | ?? Apr 99 | K. Bogle | N/A | |
| <No Data> | <No Data> | N/A | ||
| <No Data> | <No Data> | N/A | ||
| <No Data> | <No Data> | N/A | ||
| <No Data> | 15 Apr 03 | K. Bogle | N/A | |
| <No Data> | <No Data> | N/A | ||
| <No Data> | <No Data> | N/A | ||
| <No Data> | 1 Apr 06 | K. Bogle | N/A | |
| <No Data> | <No Data> | N/A | ||
| <No Data> | 19 Apr 08 | K. Bogle | N/A | |
| <No Data> | <No Data> | N/A | ||
| <No Data> | <No Data> | N/A | ||
| <No Data> | <No Data> | N/A | ||
| <No Data> | <No Data> | N/A | ||
| <No Data> | <No Data> | N/A | ||
| <No Data> | <No Data> | N/A | ||
| <No Data> | <No Data> | N/A | ||
| 11 Jan 16 | T. Edwards | 11 Mar 16 | K. Shields | 61 |
| 12 Dec 16 | K. Shields | 11 Apr 17 | K. Shields | 120 |
| 18 Dec 17 | K. Shields | 9 Apr 18 | K. Shields | 112 |
| 7 Dec 18 | K. Shields | 5 Apr 19 | K. Shields | 119 |
| 15 Dec 19 | K. Shields | 18 Mar 20 | K. Shields | 94 |
| 19 Dec 20 | K. Shields | 27 Mar 21 | K. Shields | 98 |
| 21 Dec 21 | K. Shields | 26 Mar 22 | K. Shields | 95 |
| 25 Dec 22 | K. Shields | 4 Apr 23 | K, Shields | 100 |
| 16 Jan 24 | K. Shields | 5 Mar 24 | K. Shields | 49 |
Median Ice-IN days over last nine (9) years = 98.00
Footnote:
Nine (9) years ago it became apparent that while Ice-Out dates were an interesting statistic to keep, we needed to also track Ice-In dates to get a better picture of how many days Clough Pond was covered in ice. The fewer Ice-In days there were the more warm days there would be when the water in Clough Pond would be suitable for plant-life to flourish, including cyanobacteria and other nuisance vegetation. Since NHDES started also logging Ice-In dates from around the state we joined the effort.
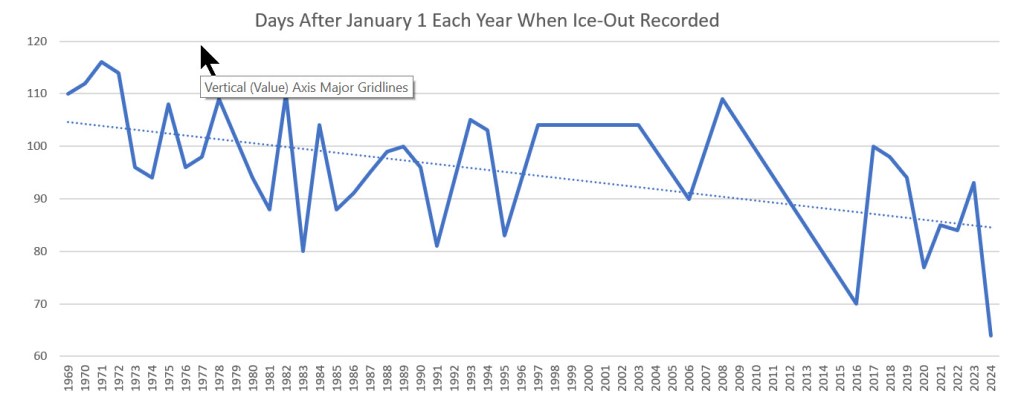
As a substitute perspective for tracking the duration of Ice-In days each year, we have created the following graph depicting the number of days between January 1st of each year and actual Ice-Out. There is a clear downward trend in this statistic.
Of special note is the 2023-2024 season data. Ice-In did not occur until mid-January. As a result the number of days of Ice-In since January 1st overstates the actual coverage. To keep the data consistent with out historical data (we have no Ice-In data for any year before 2016), we consistently drew this chart based on January 1st to Ice-Out dates. Note that over the years this may not have been as unique as one would think. Even our own recent Ice-In data shows the Ice-In data for 2016 and 2024 were also in January.